

II. Industry and Construction
In 2021, the total value added of industrial sectors was 37,257.5 billion yuan, up by 9.6 percent over the previous year. The value added of the industrial enterprises above the designated size increased by 9.6 percent. Among them, in term of ownership, that of state-holding enterprises was up by 8.0 percent, share-holding enterprises by 9.8, the enterprises funded by overseas investors by 8.9, and private enterprises by 10.2. While in term of sector, that of mining was up by 5.3 percent, manufacturing by 9.8, and the production and supply of electricity, heat power, gas and water by 11.4.
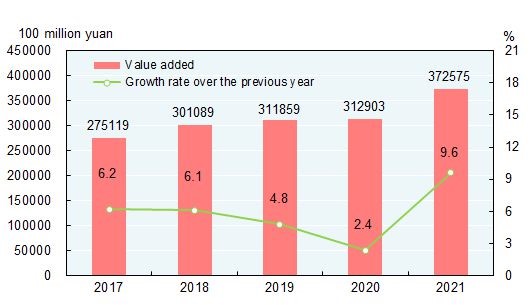
Figure 8: Value Added and Growth Rate of Industrial Enterprises 2017-2021
In 2021, of the industrial enterprises above the designated size, the value added of food processing from agricultural and sideline products was up by 7.7 percent over the previous year, textile products by 1.4, raw chemical materials and chemical products by 7.7, non-metallic mineral products by 8.0, smelting and pressing of ferrous metals by 1.2,machinery manufacture of general purpose by 12.4, of special purpose by 12.6, of automobiles by 5.5, of electrical machinery and apparatus by 16.8, of computer, communication equipment and other electronic equipment by 15.7, and the production and supply of electricity and heat power by 10.9.
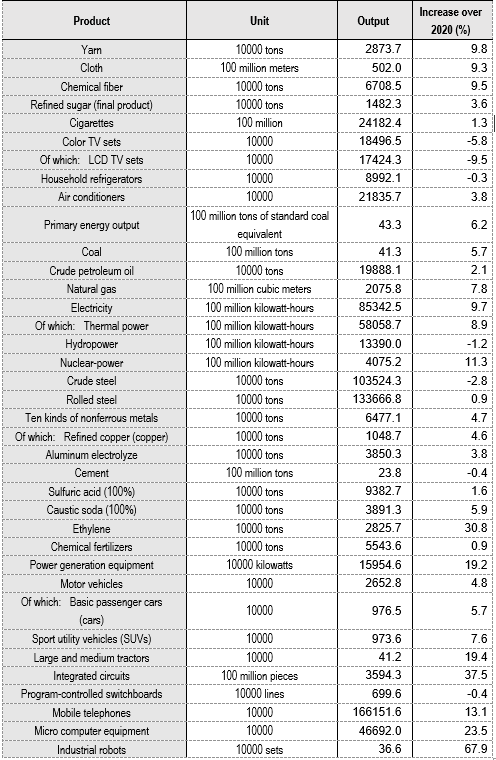
Table 3: Output of Major Industrial Products and Growth Rate in 2021
By the end of 2021, the installed power generation capacity was 2,376.92 million kilowatts, up by 7.9 percent over the year of 2020, among which the thermal power was 1,296.78 million kilowatts, up by 4.1 percent; the hydropower was 390.92 million kilowatts, up by 5.6 percent; the nuclear power was 53.26 million kilowatts, up by 6.8 percent; the grid-connected wind power was 328.48 million kilowatts, up by 16.6 percent; and the grid-connected solar power was 306.56 million kilowatts, up by 20.9 percent.
In 2021, the profits made by the industrial enterprises above the designated size were 8,709.2 billion yuan, up by 34.3 percent over the previous year. In term of ownership, those of state-holding enterprises were 2,277.0 billion yuan, up by 56.0 percent; of share-holding enterprises were 6,270.2 billion yuan, up by 40.2 percent; of enterprises funded by overseas investors were 2,284.6 billion yuan, up by 21.1 percent; and of private enterprises were 2,915.0 billion yuan, up by 27.6 percent. In term of industrial sector, those of mining were 1,039.1 billion yuan, up by 190.7 percent over the previous year; of manufacturing were 7,361.2 billion yuan, up by 31.6 percent; and of the production and supply of electricity, heat power, gas and water were 308.9 billion yuan, down by 41.9 percent. In 2021, the cost for per-hundred-yuan business revenue of the industrial enterprises above the designated size was 83.74 yuan, or 0.23 yuan less than that of 2020; the profit rate of the business revenue was 6.81 percent, up by 0.76 percentage points. By the end of 2021, the asset-liability ratio of the industrial enterprises above the designated size was 56.1 percent, 0.1 percentage points lower than that of 2020. The national industrial capacity utilization rate was 77.5 percent.
In 2021, the value added of construction enterprises was 8,013.8 billion yuan, up by 2.1 percent over the previous year. The profits made by construction enterprises qualified for general and specialized contracts reached 855.4 billion yuan, up by 1.3 percent over the previous year, of which the profits made by state-holding enterprises were 362.0 billion yuan, up by 8.0 percent.
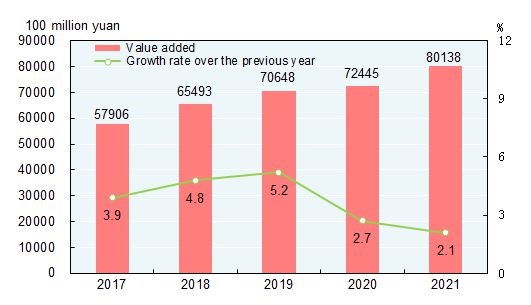
Figure 9: Value Added and Growth Rate of Construction Industry 2017-2021
III. Household Income, Consumption and Social Security
In 2021, the per capita disposable income nationwide was 35,128 yuan, increasing by 9.1 percent over the previous year, or 8.1 percent after deducting price factors. The median of per capita disposable income nationwide was 29,975 yuan, up by 8.8 percent. In term of permanent residence, the per capita disposable income of urban households was 47,412 yuan, up by 8.2 percent, or 7.1 percent after deducting price factors. The median of per capita disposable income of urban households was 43,504 yuan, up by 7.7 percent. The per capita disposable income of rural households was 18,931 yuan, up by 10.5 percent, or 9.7 percent after deducting price factors. The median of per capita disposable income of rural households was 16,902 yuan, up by 11.2 percent. The urban-rural ratio of per capita disposable income was 2.50, narrowed by 0.06. Grouped by income quintile, the per capita disposable income of low-income group reached 8,333 yuan, the lower-middle-income group 18,445 yuan, the middle-income group 29,053 yuan, the upper-middle-income group 44,949 yuan, and the high-income group 85,836 yuan. The per capita monthly income of migrant workers was 4,432 yuan, increased by 8.8 percent. In 2021, the per capita disposable income of rural households from counties lifted out of poverty was 14,051 yuan, up by 11.6 percent, or 10.8 percent after deducting price factors.
The per capita consumption expenditure was 24,100 yuan, up by 13.6 percent over the previous year, or 12.6 percent after deducting price factors. Specifically, the per capita consumption expenditure on services totaled 10,645 yuan, up by 17.8 percent, accounting for 44.2 percent of the per capita consumption expenditure. In term of permanent residence, the per capita consumption expenditure of urban households was 30,307 yuan, up by 12.2 percent, or 11.1 percent after deducting price factors. That of rural households was 15,916 yuan, up by 16.1 percent, or 15.3 percent after deducting price factors. The Engel's Coefficient stood at 29.8 percent, with that of urban and rural households standing at 28.6 percent and 32.7 percent respectively.
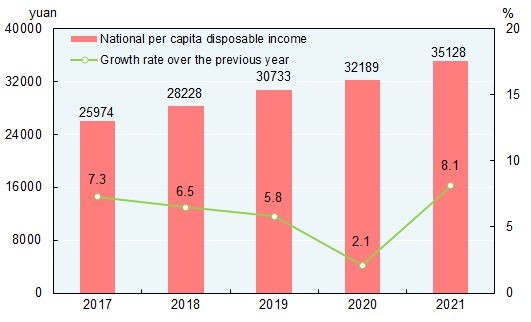
Figure 10: Per Capita Disposable Income and Its Growth Rate 2017-2021
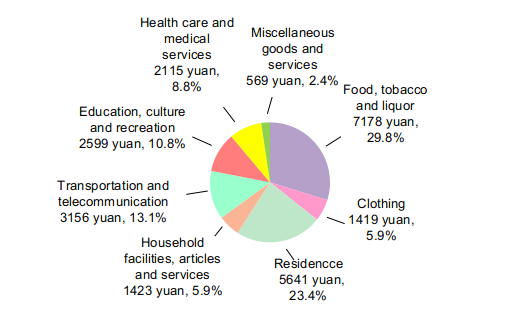
Figure 11: Per Capita Consumption Expenditure and Composition in 2021
By the end of 2021, 480.75 million people participated in basic endowment insurance program for urban workers, an increase of 24.54 million over the year of 2020. 547.97 million people participated in basic endowment insurance program for urban and rural residents, an increase of 5.54 million. 1,364.24 million people participated in basic medical insurance program, an increase of 2.93 million. Of this total, 354.22 million people participated in the program for workers, an increase of 9.67 million, and 1,010.02 million people participated in the program for urban and rural residents. A total of 229.58 million people participated in unemployment insurance program, an increase of 12.68 million. The number of people receiving unemployment insurance payment stood at 2.59 million by the end of 2021. 282.84 million people participated in work-related injury insurance, an increase of 15.21 million, of which 90.86 million were migrant workers, an increase of 1.52 million. 238.51 million people participated in maternity insurance programs, an increase of 2.83 million. By the end of 2021, minimum living allowances were granted to 7.38 million urban residents and 34.74 million rural residents, and 4.38 million rural residents living in extreme poverty received relief and assistance and 10.89 million people received temporary assistance. National subsidies and allowances were provided to 8.17 million veterans and other entitled people in 2021.
By the end of 2021, there were altogether 43 thousand social welfare institutions providing accommodation, of which 40 thousand were elderly care institutions and 801 were institutions for child welfare, assistance and protection. The social welfare institutions provided 8.402 million beds, of which 8.135 million were for the elderly and 96 thousand were for children. By the end of 2021, there were 29 thousand community service centers and 472 thousand community service stations.
Edited by Wang Miao with reference to
<http://www.gov.cn/xinwen/2022-02/28/content_5676015.html> and <http://www.stats.gov.cn/english/PressRelease/202202/t20220227_1827963.html>