

National Bureau of Statistics of China
February 28, 2021
The year of 2020 was an unusual year in the history of the People’s Republic of China, as the country faces complicated international situations, arduous tasks in seeking reform, development and stability at home and heavy blows from the COVID-19 epidemic in particular. The Central Committee of the Communist Party of China (CPC) with Comrade Xi Jinping as the core made the overall planning, maintained strategic focus, made accurate judgement on situations and well-planned deployment, took decisive actions, paid arduous efforts, and made major and timely decisions on coordinating efforts to advance both the epidemic prevention and control and economic and social development. Under the guidance of Xi Jinping Thought on Socialism with Chinese Characteristics for a New Era, all regions and departments fully implemented the spirit of the 19th National Congress of the CPC and the second, third, fourth and fifth plenary sessions of the 19th Central Committee of the CPC, followed the decisions and arrangements made by the CPC Central Committee and the State Council, responded to the risks and challenges composedly, committed unswervingly to the high-quality development, and coordinated efforts to advance both the epidemic prevention and control and economic and social development. All regions and departments took solid steps to stabilize employment, financial operation, foreign trade, foreign investment, domestic investment and market expectations (six areas), and fully safeguarded employment, basic living needs, operation of market entities, food and energy security, stable industrial and supply chains and the normal functioning of primary-level governments (six fronts). As a result, the economy recovered to normal quarter by quarter, making China the only major economy with positive economic growth in the world. With a complete victory in the fight of poverty reduction and great decisive accomplishments in building a moderately prosperous society in all respects, China has made historic achievements that have satisfied the people and impressed the world.
I. General Outlook[2]
According to preliminary estimation, the gross domestic product (GDP) [3] in 2020 was 101,598.6 billion yuan, up by 2.3 percent over the previous year. Of this total, the value added of the primary industry was 7,775.4 billion yuan, up by 3.0 percent, that of the secondary industry was 38,425.5 billion yuan, up by 2.6 percent and that of the tertiary industry was 55,397.7 billion yuan, up by 2.1 percent. The value added of the primary industry accounted for 7.7 percent of the GDP; that of the secondary industry accounted for 37.8 percent; and that of the tertiary industry accounted for 54.5 percent. The contribution of the final consumption expenditure to GDP growth rate was down by 0.5 percentage points, that of the gross capital formation up by 2.2 percentage points and that of the net exports of goods and services up by 0.7 percentage points. By quarter, GDP in the first quarter was down by 6.8 percent year on year, up by 3.2 percent in the second quarter, up by 4.9 percent in the third quarter, and up by 6.5 percent in the fourth quarter. The per capita GDP in 2020 was expected to be 72,447 yuan, up by 2.0 percent over the previous year. The gross national income[4] in 2020 was 100,915.1 billion yuan, up by 1.9 percent over the previous year. The national energy consumption per 10,000 yuan worth of GDP[5] went down by 0.1 percent over 2019, and the overall labor productivity[6] was expected to reach 117,746 yuan per person in 2020, up by 2.5 percent over the previous year.
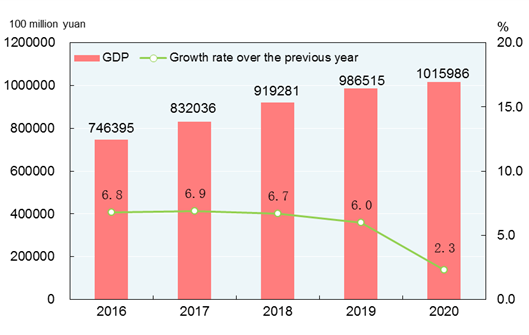
Figure 1: Gross Domestic Product and Growth Rates
2016-2020
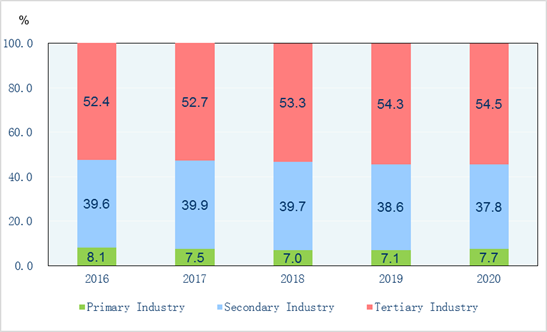
Figure 2: Shares of the Three Industries’ Value Added of GDP 2016-2020
The newly increased employed people in urban areas numbered 11.86 million, 1.66 million less than the previous year. The surveyed urban unemployment rate was 5.2 percent at the year end, and the registered urban unemployment rate was 4.2 percent. The total number of migrant workers[7] was 285.60 million, down by 1.8 percent over that of 2019. Specifically, the number of migrant workers who left their hometowns and worked in other places was 169.59 million, down by 2.7 percent, and those who worked in their own localities reached 116.01 million, down by 0.4 percent.
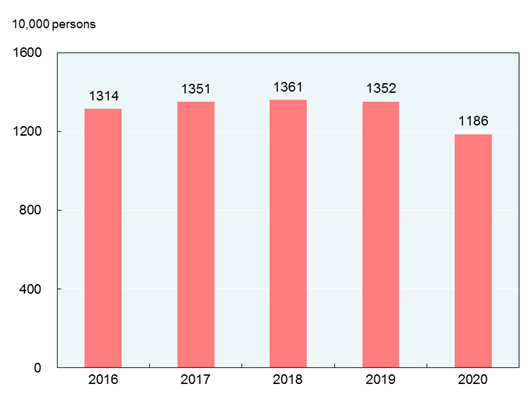
Figure 3:Newly Increased Employed People in Urban Areas 2016-2020
The consumer prices in 2020 went up by 2.5 percent over the previous year. The producer prices for industrial products went down by 1.8 percent and the purchasing prices for industrial producers down by 2.3 percent. The producer prices for farm products[8] increased by 15.0 percent. In December, out of the 70 large and medium-sized cities, 60 cities experienced a year-on-year rise in sales prices of new commercial residential buildings and 10 cities experienced a decline.
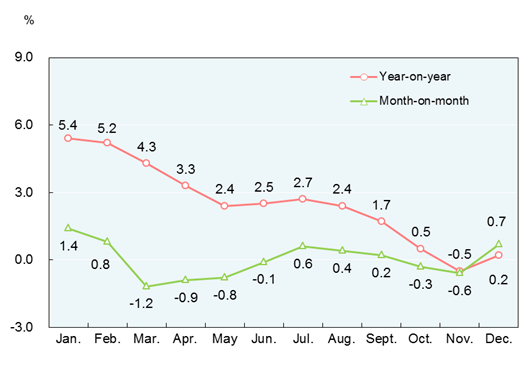
Figure 4:Monthly Changes of Consumer Prices in 2020
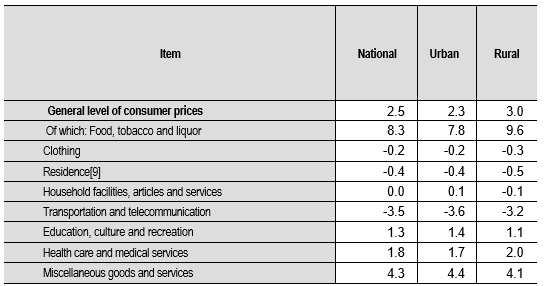
Table 1: Changes of Consumer Prices in 2020 Unit: %
At the end of 2020, China’s foreign exchange reserves reached 3,216.5 billion US dollars, an increase of 108.6 billion US dollars compared with that at the end of 2019. The average exchange rate of the year was 6.8974 RMB to 1 USD dollar, appreciated by 0.02 percent over that of 2019.
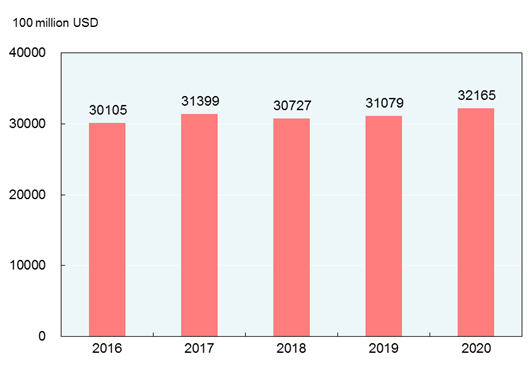
Figure 5:Year-end China's Foreign Exchange Reserves 2016-2020
Decisive achievements were made in the three critical battles. Based on the current rural poverty line of an individual’s cost of living per year of 2,300 yuan (at 2010 constant prices), 5.51 million rural population living in poverty were lifted out of poverty. Since the 18th National Congress of the Communist Party of China, the absolute poverty was eradicated historically with 98.99 million rural poor population and all poverty-stricken counties lifted out of poverty. In 2020, the per capita disposable income of rural residents in impoverished areas[10] was 12,588 yuan, up by 8.8 percent over the previous year, or a real growth of 5.6 percent after deducting price factors. Of the monitored 337 cities at prefecture level and above, 59.9 percent reached the air quality standard and 40.1 percent failed. The annual average concentration of particulate matter (PM2.5) for cities that failed to meet the standard (based on the 262 cities that failed to meet the standard of annual average PM2.5 concentration in 2015) was 37 micrograms per cubic meter, down by 7.5 percent over that of the previous year. In 2020, of the 1940 sections under the national monitoring program for surface water, 83.4 percent were fairly clean water quality (Grade I to III), 13.6 percent were Grade IV, 2.4 percent were Grade V and 0.6 percent was worse than Grade V national standard. By the end of 2020, the outstanding liability of local governments nationwide was within the limit approved by the National People’s Congress. Major progress have been made in financial risks management.
New industries, new types of business and new business models grew despite headwinds. Among the industries above the designated size, the value added of high technology manufacturing industry[11] grew by 7.1 percent over the previous year, accounting for 15.1 percent of that of all industrial enterprises above the designated size. The value added for the manufacture of equipment[12] was up by 6.6 percent, accounting for 33.7 percent of that of all industrial enterprises above the designated size. Among the service enterprises above the designated size[13], the business revenue of the strategic emerging service industries[14] went up by 8.3 percent over the previous year. In 2020, the investment in high technology industries[15] increased by 10.6 percent over the previous year. The output of new energy vehicles in 2020 reached 1.456 million, up by 17.3 percent over the previous year, and that of integrated circuits was 261.47 billion, up by 29.6 percent. In 2020, the online retail sales[16] reached 11,760.1 billion yuan, an increase of 10.9 percent over the previous year on a comparable basis. In 2020, the number of newly registered market entities was 25.02 million with 22 thousand market entities newly registered per day on average. By the end of 2020, the market entities totaled 140 million.
Regional coordinated development was pushed forward steadily. By the end of 2020, the urbanization rate of permanent residents exceeded 60 percent. By region[17], in 2020, the gross domestic product in the eastern areas was 52,575.2 billion yuan, an increase of 2.9 percent compared with the previous year; the central areas, 22,224.6 billion yuan, up by 1.3 percent; the western areas, 21,329.2 billion yuan, up by 3.3 percent; and the northeastern areas, 5,112.5 billion yuan, up by 1.1 percent. In 2020, the gross domestic product in Beijing-Tianjin-Hebei Region reached 8,639.3 billion yuan, up by 2.4 percent over the previous year; that in the Yangtze River Economic Belt, 47,158.0 billion yuan, up by 2.7 percent; and that in the Yangtze River Delta, 24,471.4 billion yuan, up by 3.3 percent. Major regional strategies like construction of Guangdong-Hong Kong-Macao Greater Bay Areas, ecological protection in Yellow River Basin and high-quality development were further implemented.
II. Agriculture
In 2020, the sown area of grain was 116.77 million hectares, an increase of 0.70 million hectares compared with that in 2019. Of this total, the sown area of rice was 30.08 million hectares, an increase of 0.38 million hectares; the sown area of wheat was 23.38 million hectares, a decrease of 0.35 million hectares; the sown area of corn was 41.26 million hectares, a decrease of 20 thousand hectares. The sown area of cotton was 3.17 million hectares, a decrease of 0.17 million hectares. The sown area of oil-bearing crops was 13.13 million hectares, up by 0.20 million hectares; the sown area of sugar crops was 1.57 million hectares, down by 40 thousand hectares.
The total output of grain in 2020 was 669.49 million tons, an increase of 5.65 million tons over the previous year, or up by 0.9 percent. Of this total, the output of summer crops was 142.86 million tons, up by 0.9 percent, and that of the early rice was 27.29 million tons, up by 3.9 percent. The output of autumn grain was 499.34 million tons, up by 0.7 percent. The output of cereal in 2020 was 616.74 million tons, up by 0.5 percent over 2019, among which the output of rice was 211.86 million tons, up by 1.1 percent; that of wheat was 134.25 million tons, up by 0.5 percent; and that of corn was 260.67 million tons, roughly the same but a little less than that of 2019.
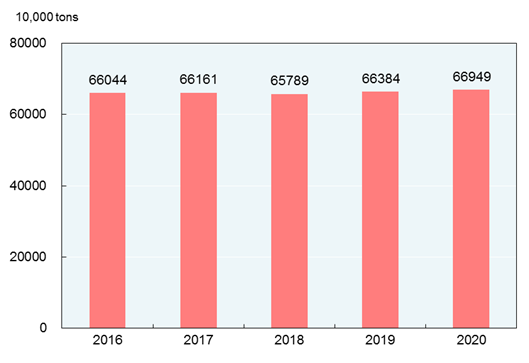
Figure 6: Output of Grain 2016-2020
In 2020, the output of cotton was 5.91 million tons, up by 0.4 percent over the previous year, that of oil-bearing crops was 35.85 million tons, up by 2.6 percent, that of sugar crops was 120.28 million tons, down by 1.2 percent, and that of tea was 2.97 million tons, up by 7.1 percent.
The total output of pork, beef, mutton and poultry in 2020 was 76.39 million tons, down by 0.1 percent over the previous year. Of this total, the output of pork was 41.13 million tons, down by 3.3 percent; that of beef was 6.72 million tons, up by 0.8 percent; that of mutton was 4.92 million tons, up by 1.0 percent; and that of poultry was 23.61 million tons, up by 5.5 percent. The total output of eggs was 34.68 million tons, up by 4.8 percent. The production of milk was 34.40 million tons, up by 7.5 percent. At the end of the year, 406.50 million pigs were registered in the total stocks, up by 31.0 percent compared with that at the end of 2019, and 527.04 million pigs were slaughtered, down by 3.2 percent over the previous year.
The total output of aquatic products in 2020 was 65.45 million tons, up by 1.0 percent over the previous year. Of this total, the output of cultured aquatic products was 52.15 million tons, up by 3.0 percent; and that of fished aquatic products was 13.30 million tons, down by 5.0 percent.
The total production of timber in 2020 reached 87.27 million cubic meters, down by 13.1 percent over the previous year.
In 2020, over 0.43 million hectares of farmland were newly equipped with irrigation systems and another 1.60 million hectares of farmland was newly equipped with water-saving irrigation systems.
III. Industry and Construction
In 2020, the total value added of the industrial sector was 31,307.1 billion yuan, up by 2.4 percent over the previous year. The value added of industrial enterprises above the designated size increased by 2.8 percent. Of the industrial enterprises above the designated size, in terms of ownership, the value added of the state-holding enterprises grew by 2.2 percent, that of the share-holding enterprises up by 3.0 percent, that of the enterprises funded by foreign investors and investors from Hong Kong, Macao and Taiwan up by 2.4 percent and that of private enterprises up by 3.7 percent. In terms of sectors, the value added of the mining industry was up by 0.5 percent, that of manufacturing up by 3.4 percent and that of production and supply of electricity, heat power, gas and water up by 2.0 percent.
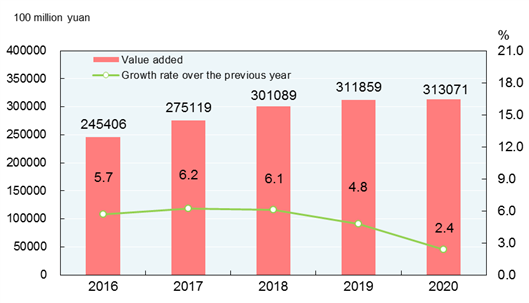
Figure 7: Value Added and Growth Rates of Industrial Enterprises 2016-2020
In 2020, of the industrial enterprises above the designated size, the value added for processing of food from agricultural and sideline products was down by 1.5 percent over the previous year; for textile industry up by 0.7 percent; for manufacture of raw chemical materials and chemical products up by 3.4 percent; for manufacture of non-metallic mineral products up by 2.8 percent; for smelting and pressing of ferrous metals up by 6.7 percent; for manufacture of general purpose machinery up by 5.1 percent; for manufacture of special purpose machinery up by 6.3 percent; for manufacture of automobiles up by 6.6 percent; for manufacture of electrical machinery and apparatus up by 8.9 percent; for manufacture of computers, communication equipment and other electronic equipment up by 7.7 percent; for production and supply of electricity and heat power up by 1.9 percent.
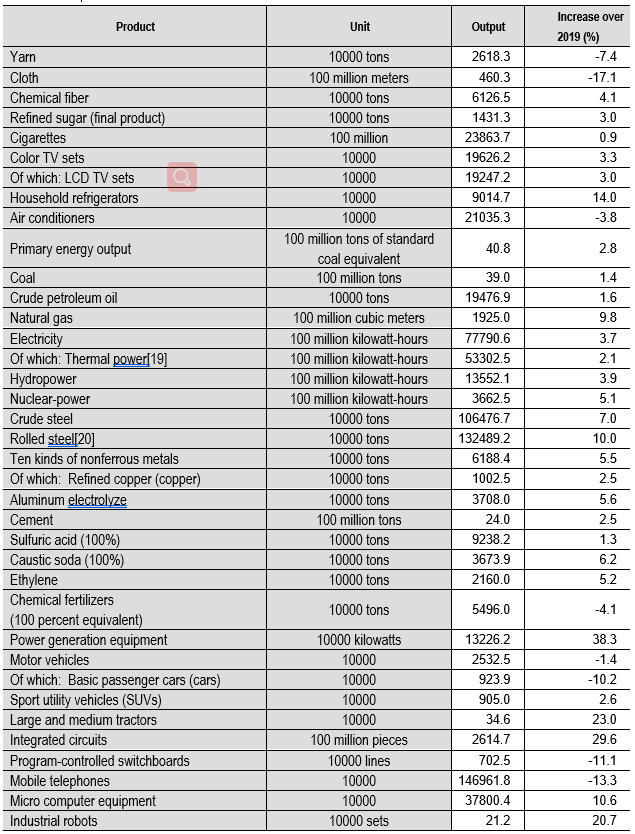
Table 2: Output of Major Industrial Products and Growth Rates in 2020[18]
By the end of 2020, the installed power generation capacity was 2,200.58 million kilowatts, up by 9.5 percent over that at the end of 2019, among which[21] the installed thermal power generation capacity was 1,245.17 million kilowatts, up by 4.7 percent; the installed hydropower generation capacity was 370.16 million kilowatts, up by 3.4 percent; the installed nuclear power generation capacity was 49.89 million kilowatts, up by 2.4 percent. The installed grid-connected wind power generation capacity was 281.53 million kilowatts, up by 34.6 percent and the installed grid-connected solar power generation capacity was 253.43 million kilowatts, up by 24.1 percent.
In 2020, the profits made by industrial enterprises above the designated size were 6,451.6 billion yuan, up by 4.1 percent[22] over the previous year. By ownership, the profits of state-holding enterprises were 1,486.1 billion yuan, down by 2.9 percent over the previous year; those of share-holding enterprises were 4,544.5 billion yuan, up by 3.4 percent; those of enterprises funded by foreign investors or investors from Hong Kong, Macao and Taiwan were 1,823.4 billion yuan, up by 7.0 percent; and those of private enterprises were 2,026.2 billion yuan, up by 3.1 percent. In terms of different sectors, the profits of mining were 355.3 billion yuan, down by 31.5 percent over the previous year; those of manufacturing were 5,579.5 billion yuan, up by 7.6 percent; and those of the production and supply of electricity, heat power, gas and water were 516.8 billion yuan, up by 4.9 percent. In 2020, the cost for per-hundred-yuan business revenue of the industrial enterprises above the designated size was 83.89 yuan, or 0.11 yuan less than that of 2019; the profit rate of the business revenue was 6.08 percent, up by 0.20 percentage points. By the end of 2020, the asset-liability ratio of industrial enterprises above the designated size was 56.1 percent, 0.3 percentage points lower than the end of 2019. The national industrial capacity utilization rate[23] was 74.5 percent in 2020, specifically 67.3 percent, 74.4 percent, 76.7percent and 78.0 percent in the first, second, third and fourth quarters.
In 2020, the value added of construction enterprises in China was 7,299.6 billion yuan, up by 3.5 percent over the previous year. The profits made by construction enterprises qualified for general contracts and specialized contracts reached 830.3 billion yuan, up by 0.3 percent over the previous year, of which the profits made by state-holding enterprises were 287.1 billion yuan, up by 4.7 percent.
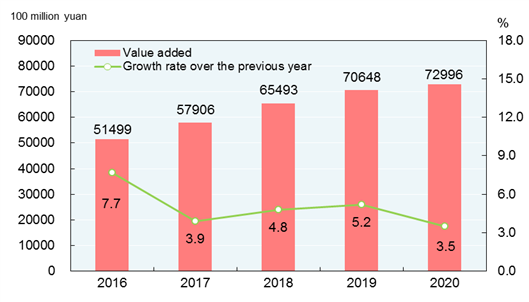
Figure 8: Value Added and Growth Rates of Construction Industry 2016-2020
Notes:
1. All figures in this Communiqué are preliminary statistics. Statistics in this Communiqué do not include Hong Kong SAR, Macao SAR and Taiwan Province. Due to the rounding-off reasons, the subentries may not add up to the aggregate totals.
2. Statistics of the seventh National Population Census undertaken in 2020 will be released in April 2021. Therefore, data about population and employment were not released in this Communiqué and the per capita data in this Communiqué were based on an estimate of the population.
3. Gross domestic product (GDP), value added of the three and related industries, regional GDP, per capita GDP and gross national income (GNI) as quoted in this Communiqué are calculated at current prices whereas their growth rates are at constant prices.
4. Gross national income, also known as gross national product, refers to the total primary distribution of the income created by all the resident units of a country (or a region) during a certain period of time. It equals to gross domestic product plus the net primary distribution of income from abroad.
5. The national energy consumption per 10,000 yuan worth of GDP is calculated at constant prices of 2015.
6. The overall labor productivity refers to the ratio between the GDP (at 2015 constant prices) and the total number of persons employed. The number of persons employed in 2020 was an estimate.
7. The number of migrant workers includes those who are employed outside their villages and towns for more than six months in the year and those who are engaged in non-agricultural work in their villages and towns for more than six months in the year.
8. The producer prices for farm products refer to the prices of farm products sold directly by producers.
9. The prices for residence include prices for rent, maintenance and management, water, electricity and fuel etc.
10. Impoverished areas cover contiguous poverty-stricken areas and key counties under national poverty alleviation and development program beyond those areas. There were 832 counties altogether. Since 2017, Aksu Prefecture in Xinjiang has also been covered in poverty monitoring.
11. High technology manufacturing industry includes manufacture of medicine, manufacture of aerospace vehicle and equipment, manufacture of electronic and communication equipment, manufacture of computers and office equipment, manufacture of medical equipment, manufacture of measuring instrument and equipment and manufacture of optical and photographic equipment.
12. Manufacture of equipment includes manufacture of metal products, general purpose equipment, special purpose equipment, automobiles, railway, ship, aerospace and other transport equipment, electrical machinery and apparatus, computers, communication and other electric equipment and measuring instrument and machinery.
13. Service enterprises above the designated size, refer to legal entities of transport, storage and post, information transmission, software and information technology services, water conservancy, environment and public facilities management, and health with annual business revenue of 20 million yuan or above; legal entities of real estate (excluding real estate development and operation), leasing and business services, scientific research and technology services and education with annual business revenue of 10 million yuan or above; and legal entities of services to households, repair and other services and culture, sports and entertainment, and social work with annual business revenue of 5 million yuan or above.
14. Strategic emerging service industries refer to the related service sectors of information technology of new generation, manufacture of high-end equipment, new materials, biotech, new energy vehicles, new energy, energy-saving and environmental protection and digital creative industries, and service industries related to new technology and new entrepreneurship. The growth rate of the business revenue of the strategic emerging service industries in 2020 is calculated on a comparable basis.
15. Investment in high technology industries refers to investment in six high technology manufacturing industries, including the manufacture of medicine and manufacture of aerospace vehicle and equipment, and nine high technology service industries, including information service and e-commerce service.
16. Online retail sales refer to the retail sales of goods and services realized through internet trading platforms (online platforms mainly in trading physical commodities, including self-built websites and third-party platforms).
17. The eastern areas include 10 provinces and municipalities: Beijing, Tianjin, Hebei, Shanghai, Jiangsu, Zhejiang, Fujian, Shandong, Guangdong and Hainan; the central areas cover 6 provinces: Shanxi, Anhui, Jiangxi, Henan, Hubei and Hunan; the western areas include 12 provinces, autonomous regions and municipalities: Inner Mongolia, Guangxi, Chongqing, Sichuan, Guizhou, Yunnan, Tibet, Shaanxi, Gansu, Qinghai, Ningxia and Xinjiang; the northeastern areas include 3 provinces: Liaoning, Jilin and Heilongjiang.
18. Output data of some products were verified and adjusted in 2019; the growth rates of output in 2020 are calculated on a comparable basis.
19. Thermal power refers to electricity generated by coal, oil, gas, residual heat, pressure and gas, waste incineration and biomass.
20. The data include 305.66 million tons of steel which has been reprocessed among enterprises.
21. Some installed power generation capacity was not listed (e.g. geothermal).
22. The growth rates and rate changes of financial indicators of industrial enterprises above the designated size in 2020 are calculated on a comparable basis due to adjustments of data coverage in the statistical programmes, statistical law enforcement and removal of duplicated data.
23. Capacity utilization rate refers to the ratio of the actual production to the production capacity (in terms of value). Actual production refers to the total industrial output value during the enterprise’s reporting period. Production capacity refers to the production which can be realized and sustained for a long term under the condition of the supply of labor force, materials, fuel and transportation guaranteed and the production equipment in proper operation.
Source: <http://www.stats.gov.cn/english/PressRelease/202102/t20210228_1814177.html>
Edited by Bao Lianying