

STATISTICAL COMMUNIQU OF THE PEOPLE'S REPUBLIC OF CHINA
ON THE 2024 NATIONAL ECONOMIC AND SOCIAL DEVELOPMENT
(CHAPTER 2-4)
National Bureau of Statistics of China
February 28, 2025
II. Agriculture
In 2024, the sown area of grain was 119.32 million hectares, an increase of 0.35 million hectares compared with that in 2023. Of this total, the sown area of rice was 29.01 million hectares, an increase of 0.06 million hectares; the sown area of wheat was 23.59 million hectares, a decrease of 0.04 million hectares; the sown area of corn was 44.74 million hectares, an increase of 0.52 million hectares; the sown area of soybean was 10.33 million hectares, a decrease of 0.15 million hectares. The sown area of cotton was 2.84 million hectares, an increase of 0.05 million hectares. The sown area of oil-bearing crops was 14.29 million hectares, an increase of 0.37 million hectares; the sown area of sugar crops was 1.48 million hectares, an increase of 0.07 million hectares.
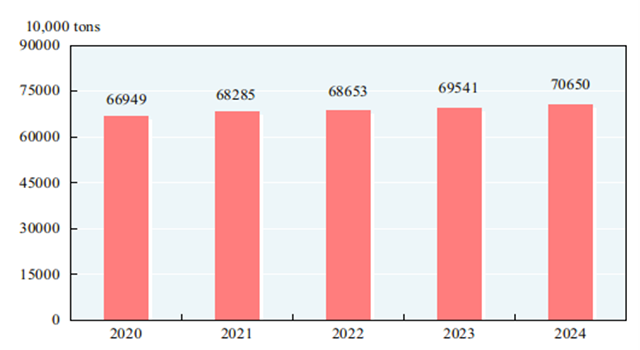
The total output of grain in 2024 was 706.50 million tons, an increase of 11.09 million tons over the previous year, up by 1.6 percent. Of this total, the output of summer crops was 149.89 million tons, up by 2.6 percent, that of the early rice was 28.17 million tons, down by 0.6 percent, and that of autumn grain was 528.43 million tons, up by 1.4 percent. The output of cereal was 652.29 million tons, up by 1.7 percent over that of 2023, among which the output of rice was 207.53 million tons, up by 0.5 percent; that of wheat was 140.10 million tons, up by 2.6 percent; and that of corn was 294.92 million tons, up by 2.1 percent. The output of soybean was 20.65 million tons, down by 0.9 percent over the previous year.
Figure 8: Output of Grain 2020-2024
In 2024, the output of cotton was 6.16 million tons, up by 9.7 percent over the previous year, that of oil-bearing crops was 39.79 million tons, up by 3.0 percent, that of sugar crops was 118.70 million tons, up by 4.3 percent, and that of tea was 3.74 million tons, up by 5.5 percent.
The total output of pork, beef, mutton and poultry in 2024 was 96.63 million tons, up by 0.2 percent over the previous year. Of this total, the output of pork was 57.06 million tons, down by 1.5 percent; that of beef was 7.79 million tons, up by 3.5 percent; that of mutton was 5.18 million tons, down by 2.5 percent; and that of poultry was 26.60 million tons, up by 3.8 percent. The total output of eggs was 35.88 million tons, up by 0.7 percent. The output of milk was 40.79 million tons, down by 2.8 percent. At the end of the year, 427.43 million pigs were registered in the total stocks, down by 1.6 percent compared with that at the end of 2023, and 702.56 million pigs were slaughtered, down by 3.3 percent over the previous year.
The total output of aquatic products in 2024 was 73.66 million tons, up by 3.5 percent over the previous year. Of this total, the output of cultured aquatic products was 60.62 million tons, up by 4.3 percent; and that of fished aquatic products was 13.05 million tons, down by 0.1 percent.
The total production of timber in 2024 reached 137.40 million cubic meters, up by 8.2 percent over the previous year.
III. Industry and Construction
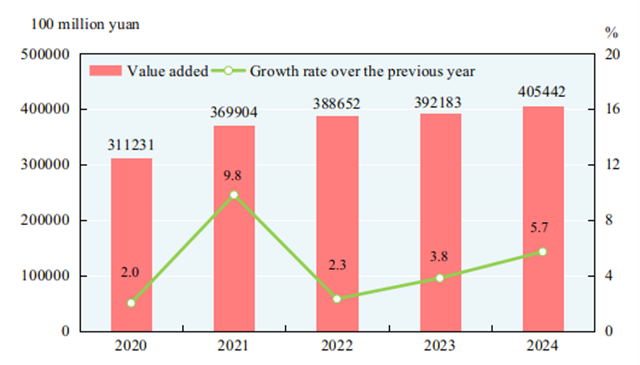
In 2024, the total value added of the industrial sector was 40,544.2 billion yuan, up by 5.7 percent over the previous year. The value added of industrial enterprises above the designated size increased by 5.8 percent. Of the industrial enterprises above the designated size, in terms of ownership, the value added of the state-holding enterprises was up by 4.2 percent, that of the share-holding enterprises up by 6.1 percent, that of the enterprises funded by foreign investors and investors from Hong Kong, Macao and Taiwan up by 4.0 percent and that of private enterprises up by 5.3 percent. In terms of sectors, the value added of the mining industry was up by 3.1 percent, that of manufacturing up by 6.1 percent and that of production and supply of electricity, heat power, gas and water up by 5.3 percent.
Figure 9: Value Added and Growth Rates of Industrial Enterprises 2020-2024
In 2024, of the industrial enterprises above the designated size, the value added for processing of food from agricultural and sideline products was up by 2.2 percent over the previous year; for textile industry up by 5.1 percent; for manufacture of raw chemical materials and chemical products up by 8.9 percent; for manufacture of non-metallic mineral products down by 1.4 percent; for smelting and pressing of ferrous metals up by 4.0 percent; for manufacture of general purpose machinery up by 3.6 percent; for manufacture of special purpose machinery up by 2.8 percent; for manufacture of automobiles up by 9.1 percent; for manufacture of electrical machinery and apparatus up by 5.1 percent; for manufacture of computers, communication equipment and other electronic equipment up by 11.8 percent; for production and supply of electricity and heat power up by 5.2 percent.
Table 3: Output of Major Industrial Products and Growth Rates of the Industrial Enterprises above the Designated Size in 2024[22]
Product | Unit | Output | Increase over 2023 (%) |
Yarn | 10000 tons | 2277.9 | 1.3 |
Cloth | 100 million meters | 306.3 | 2.2 |
Chemical fiber | 10000 tons | 7910.8 | 9.7 |
Refined sugar (final product) | 10000 tons | 1498.6 | 17.0 |
Cigarettes | 100 million | 24654.6 | 0.9 |
Color TV sets | 10000 | 20745.4 | 4.6 |
Household refrigerators | 10000 | 10395.7 | 8.3 |
Air conditioners | 10000 | 26598.4 | 9.7 |
Crude steel | 10000 tons | 100509.1 | -1.7 |
Rolled steel[23] | 10000 tons | 139967.4 | 1.1 |
Ten kinds of nonferrous metals | 10000 tons | 7918.8 | 4.3 |
Of which: Refined copper (copper) | 10000 tons | 1364.4 | 4.1 |
Aluminum electrolyze | 10000 tons | 4400.5 | 4.6 |
Cement | 100 million tons | 18.3 | -9.5 |
Sulfuric acid (100%) | 10000 tons | 10369.9 | 6.9 |
Caustic soda (100%) | 10000 tons | 4365.7 | 5.5 |
Ethylene | 10000 tons | 3493.4 | 0.7 |
Chemical fertilizer (100 percent equivalent) | 10000 tons | 6006.1 | 8.5 |
Power generation equipment | 10000 kilowatts | 28433.9 | 16.0 |
Motor vehicles | 10000 | 3155.9 | 4.8 |
Integrated circuits | 100 million pieces | 4514.2 | 22.2 |
Mobile telephones | 10000 | 166952.9 | 7.8 |
Micro computer equipment | 10000 | 33912.9 | 2.7 |
Industrial robots | 10000 sets | 55.6 | 14.2 |
Ultra-clear glass for solar industry | 10000 square meters | 287884.5 | 53.5 |
Charging piles | 10000 | 469.7 | 58.7 |
Smart watches | 10000 | 8095.4 | 5.4 |
Virtual reality devices | 10000 | 836.6 | 59.4 |
In 2024, the profits made by industrial enterprises above the designated size were 7,431.1 billion yuan, down by 3.3 percent over the previous year. By ownership, the profits of state-holding enterprises were 2,139.7 billion yuan, down by 4.6 percent over the previous year; those of share-holding enterprises were 5,616.6 billion yuan, down by 3.6 percent; those of enterprises funded by foreign investors and investors from Hong Kong, Macao and Taiwan were 1,763.8 billion yuan, down by 1.7 percent; and those of private enterprises were 2,324.6 billion yuan, up by 0.5 percent. In terms of different sectors, the profits of mining were 1,127.2 billion yuan, down by 10.0 percent over the previous year; those of manufacturing were 5,514.1 billion yuan, down by 3.9 percent; and those of the production and supply of electricity, heat power, gas and water were 789.8 billion yuan, up by 14.5 percent. The cost for per-hundred-yuan business revenue of the industrial enterprises above the designated size was 85.16 yuan, 0.36 yuan more than that of 2023; the profit rate of the business revenue was 5.39 percent, 0.30 percentage points down. By the end of 2024, the asset-liability ratio of industrial enterprises above the designated size was 57.5 percent, 0.1 percentage points higher than that at the end of 2023. The capacity utilization rate[24] of industrial enterprises above the designated size was 75.0 percent in 2024.
According to preliminary estimates, the total primary energy output[25] in 2024 was 4.98 billion tons of standard coal equivalent, up by 4.6 percent over that of the previous year.
Table 4: Output of Major Energy Products and Growth Rates in 2024
Product | Unit | Output | Increase over 2023 (%) |
Coal | 100 million tons | 47.8 | 1.2 |
Crude petroleum oil | 10000 tons | 21289.1 | 1.8 |
Natural gas | 100 million cubic meters | 2464.5 | 6.0 |
Electricity | 100 million kilowatt-hours | 100868.8 | 6.7 |
Of which: Thermal power[26] | 100 million kilowatt-hours | 63742.6 | 1.7 |
Hydropower | 100 million kilowatt-hours | 14256.8 | 10.9 |
Nuclear-power | 100 million kilowatt-hours | 4508.5 | 3.7 |
Wind power | 100 million kilowatt-hours | 9970.4 | 12.5 |
Solar power | 100 million kilowatt-hours | 8390.4 | 43.6 |
By the end of 2024, the installed power generation capacity was 3,348.62 million kilowatts, up by 14.6 percent over that at the end of 2023, among which[27] the installed thermal power generation capacity was 1,444.45 million kilowatts, up by 3.8 percent; the installed hydropower generation capacity was 435.95 million kilowatts, up by 3.2 percent; the installed nuclear power generation capacity was 60.83 million kilowatts, up by 6.9 percent; the installed grid-connected wind power generation capacity was 520.68 million kilowatts, up by 18.0 percent and the installed grid-connected solar power generation capacity was 886.66 million kilowatts, up by 45.2 percent.
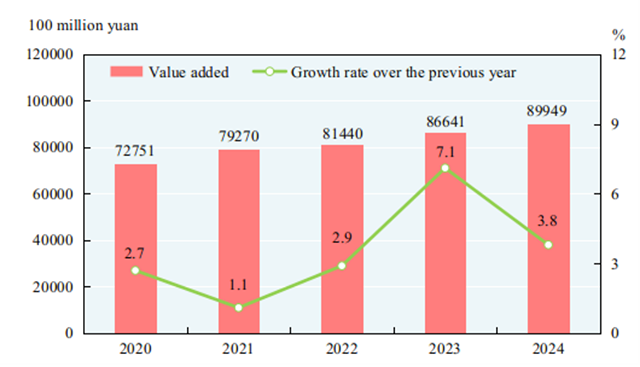
In 2024, the value added of construction enterprises was 8,994.9 billion yuan, up by 3.8 percent over the previous year. The profits made by construction enterprises qualified for general contracts and specialized contracts reached 751.3 billion yuan, down by 9.8 percent over the previous year, of which the profits made by state-holding enterprises were 366.9 billion yuan, down by 8.7 percent.
Figure 10: Value Added and Growth Rates of Construction Industry 2020-2024
IV. Service Sector
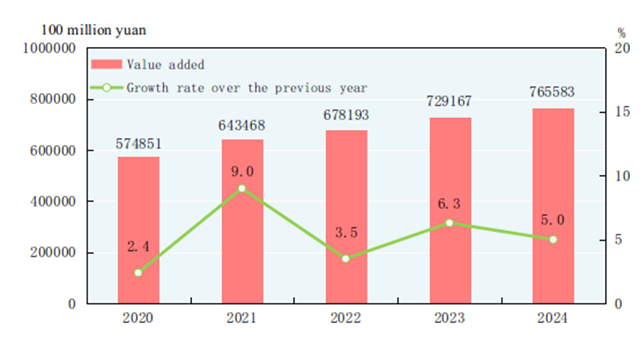
In 2024, the value added of the wholesale and retail trades was 13,798.1 billion yuan, up by 5.5 percent over the previous year; that of transport, storage and post was 5,923.2 billion yuan, up by 7.0 percent; that of hotels and catering services was 2,472.9 billion yuan, up by 6.4 percent; that of finance was 9,854.4 billion yuan, up by 5.6 percent; that of real estate was 8,456.5 billion yuan, down by 1.8 percent; that of information transmission, software and information technology services was 6,343.8 billion yuan, up by 10.9 percent; and that of leasing and business services was 5,657.6 billion yuan, up by 10.4 percent. The business revenue of service enterprises above the designated size grew by 7.2 percent over the previous year, and the total profits increased by 2.4 percent.
Figure 11: Value Added and Growth Rates of Service Sector 2020-2024
The total freight traffic[28] in 2024 reached 57.8 billion tons, up by 3.8 percent over the previous year. The freight flows were 26,194.8 billion ton-kilometers, up by 5.6 percent. The volume of freight handled by ports totaled 17.6 billion tons, up by 3.7 percent over the previous year, of which the freight for foreign trade was 5.4 billion tons, up by 6.9 percent. Container shipping of ports reached 332.00 million standard containers, up by 7.0 percent.
Table 5: Freight Traffic by All Means of Transportation and Growth Rates in 2024
Item | Unit | Volume | Increase over 2023 (%) |
Total freight traffic | 100 million tons | 578.3 | 3.8 |
Railways | 100 million tons | 51.7 | 2.8 |
Highways | 100 million tons | 418.8 | 3.8 |
Waterways | 100 million tons | 98.1 | 4.7 |
Civil aviation | 10000 tons | 898.2 | 22.1 |
Pipelines | 100 million tons | 9.5 | -0.5 |
Freight flows | 100 million ton-kilometers | 261948.1 | 5.6 |
Railways | 100 million ton-kilometers | 35861.9 | -1.6 |
Highways | 100 million ton-kilometers | 76847.5 | 3.9 |
Waterways | 100 million ton-kilometers | 141422.9 | 8.8 |
Civil aviation | 100 million ton-kilometers | 353.9 | 24.8 |
Pipelines | 100 million ton-kilometers | 7461.9 | 2.1 |
In 2024, the total passenger traffic[29] was 17.1 billion person-times, up by 8.5 percent over 2023, and the passenger flows were 3,388.6 billion person-kilometers, up by 13.6 percent.
Table 6: Passenger Traffic by All Means of Transportation and Growth Rates in 2024
Item | Unit | Volume | Increase over 2023 (%) |
Total passenger traffic | 100 million person-times | 170.8 | 8.5 |
Railways | 100 million person-times | 43.1 | 11.9 |
Highways | 100 million person-times | 117.8 | 7.0 |
Waterways | 100 million person-times | 2.6 | 0.8 |
Civil aviation | 100 million person-times | 7.3 | 17.9 |
Passenger flows | 100 million person-kilometers | 33885.5 | 13.6 |
Railways | 100 million person-kilometers | 15799.1 | 7.3 |
Highways | 100 million person-kilometers | 5117.0 | 8.0 |
Waterways | 100 million person-kilometers | 54.7 | 1.7 |
Civil aviation | 100 million person-kilometers | 12914.7 | 25.3 |
The total number of motor vehicles for civilian use reached 352.68 million (including 6.94 million tri-wheel motor vehicles and low-speed trucks) by the end of 2024, up by 16.51 million over that at the end of 2023, of which the privately-owned vehicles numbered 309.89 million, an increase of 15.62 million; new energy vehicles totaled 31.40 million, up by 10.99 million. The total number of cars for civilian use was 193.43 million, an increase of 6.75 million, of which the privately-owned cars numbered 182.04 million, an increase of 6.64 million.
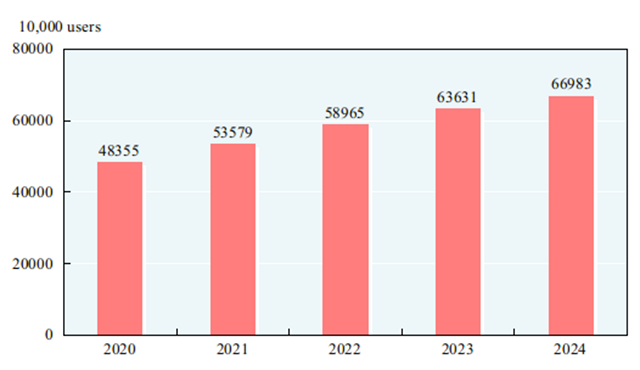
In 2024, the volume of postal and delivery services[30] totaled 193.7 billion, up by 19.2 percent over the previous year. The number of mail delivery was 0.99 billion; that of parcel delivery was 0.03 billion; and that of express delivery was 175.1 billion with a revenue reaching 1,403.4 billion yuan. The turnover of telecommunication services[31] in 2024 totaled 1,830.7 billion yuan, up by 10.0 percent over the previous year. By the end of 2024, there were 12.65 million mobile phone base stations[32], among which the number of 4G base stations reached 7.11 million and that of 5G base stations was 4.25 million. There were 1,789.60 million mobile phone subscribers in China, of whom 1,014.05 million were 5G mobile phone subscribers. The mobile phone coverage was 127.1 sets per 100 persons. The number of fixed broadband internet users[33] reached 669.83 million, an increase of 33.52 million over that at the end of the previous year. Of this total, users of broadband with the speed of 1000M and above[34] amounted to 206.83 million, an increase of 43.55 million. Users of mobile internet of things terminals[35] totaled 2.656 billion, an increase of 0.324 billion. The number of internet users was 1.108 billion, 1.105 billion of whom were mobile internet surfers. The coverage of internet was 78.6 percent, and 67.4 percent in rural areas. The mobile internet traffic in 2024 was 337.6 billion gigabytes, up by 11.6 percent over the previous year. Software revenue of software and information technology services industry[36] was 13,727.6 billion yuan, up by 10.0 percent over that of the previous year.
Figure 12: Express Delivery and Growth Rates 2020-2024[37]
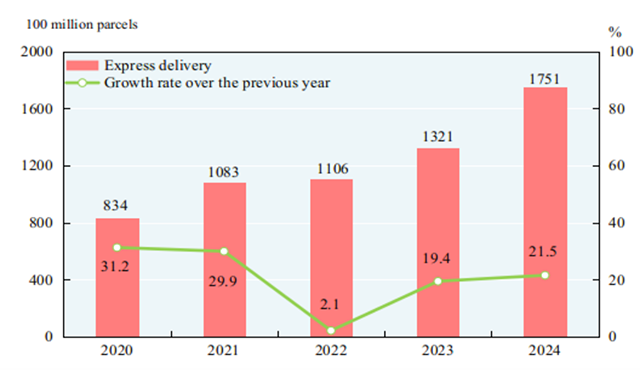
Figure 13: Year-end Number of Fixed Broadband Internet Users 2020-2024
Notes:
[22] See Note 11.
[23] The data included the steel reprocessed among enterprises.
[24] Capacity utilization rate refers to the ratio of the actual production to the production capacity (in terms of value). Actual production refers to the total industrial output value during the enterprise’s reporting period. Production capacity refers to the production which can be realized and sustained for a long term under the condition of the supply of labor force, raw materials, fuel and transportation guaranteed and the production equipment in proper operation during the reporting period.?
[25] According to Statistical Rules on Energy Consumption of Coal Enterprises (GB/T 28398-2023), solid waste generated during coal washing and processing is not included in coal consumption and comprehensive energy consumption. On this basis, adjustments were made in statistical coverage of the total primary energy output, total energy consumption and coal consumption. The growth rates of 2024 were calculated on a comparable basis.
[26] Thermal power refers to electricity generated by coal, oil, gas, residual heat, pressure and gas, waste incineration and biomass.
[27] A few installed power generation capacity (e.g. geothermal) is not listed.
[28] The total freight traffic and flows include the traffic and flows by railways, highways, waterways, civil aviation and pipelines. The growth rates in 2024 were calculated on a comparable basis.
[29] Since January 2024, the statistical coverage of highway passenger traffic and highway passenger flows has been adjusted with highway passenger traffic incorporating that of shuttle bus and chartered bus services, intercity and urban-rural bus services, and intercity and urban-rural taxi services (including cruising taxi and ride-hailing services), and highway passenger flows making corresponding adjustment. The growth rates of total passenger traffic, passenger flows, highway passenger traffic and highway passenger flows in 2024 were calculated on a comparable basis.
[30] The volume of postal and delivery services refers to the total volume of universal postal services and express delivery services provided by enterprises.
[31] The turnover of telecommunication services was calculated based on the prices of the previous year.
[32] The number of mobile phone base stations refers to the total number of wireless transceivers serving communities that handle the wireless communication between the base stations and mobile stations, relay between the mobile switchboards and mobile stations, and monitor the quality of wireless transmission at the end of the reporting period.??
[33] Fixed broadband internet users refer to those who subscribe to the telecommunication enterprises and access the Internet through xDSL, FTTx+LAN, FTTH/O and other broadband access ways as well as general dedicated lines at the end of the reporting period.
[34] Users of broadband with the speed of 1000M and above refer to those who enjoy a downstream rate of 1000Mbit/s or above at the end of the reporting period.
[35] Users of mobile internet of things terminals refer to those who access the mobile internet and subscribe to the internet of things services at the end of the reporting period. Internet of things terminals refers to the internet of things devices that connect the sensing network layer and the transmission network layer to implement remote data collection and data transmission to the network layer.
[36] Software and information technology services industry includes software development, integrated circuit design, information system integration and internet of things technology services, operation maintenance services, information processing and storage support services, IT consulting services, digital content services and other IT services industry. The growth rate of software revenue of software and information technology services industry in 2024 was calculated on a comparable basis.
[37] The statistical coverage of express delivery was adjusted in 2024 and the growth rate was calculated on a comparable basis.
Source:
Website of National Bureau of Statistics of China <https://www.stats.gov.cn/english/PressRelease/202502/t20250228_1958822.html>