
1.2 Eutrophication
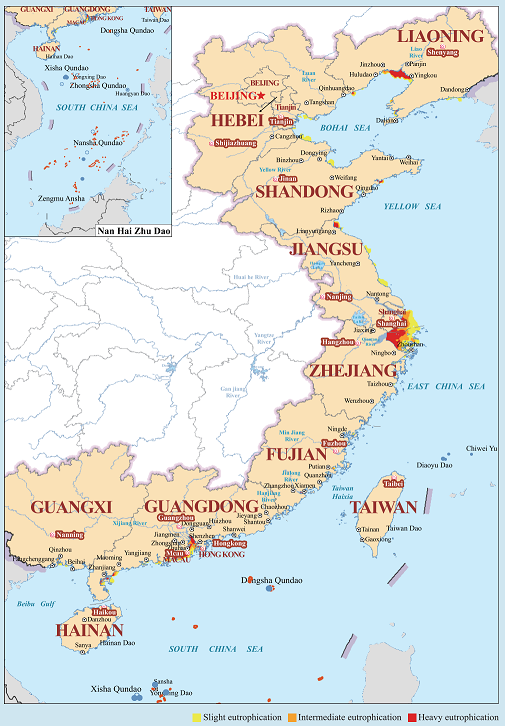
In 2022, the sea areas under eutrophication status totalled 28,770 km² in summer, decreased by1,400 km² from that of the previous year. The sea areas with Slight, Intermediate, and Heavy eutrophication were 12,900 km², 6,940 km² and 8,930 km², respectively. Heavy eutrophication areas were mainly located near Liaodong Bay, Yangtze River Estuary, Hangzhou Bay, and Pearl River Estuary. From 2011 to 2022, total eutrophication sea areas under China's jurisdiction trended to decline.

Table 9: Sea areas under eutrophication status under China's jurisdiction in 2022

Table 10: Variation of eutrophication areas under jurisdiction of China during 2011-2022

Fig. 4 Eutrophication status in the sea areas under China's jurisdiction in 2022
1.3 Marine Litter
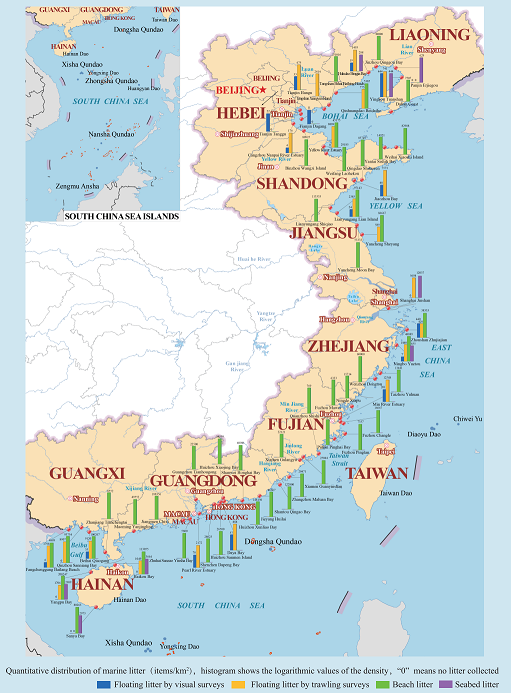
In 2022, marine litter was monitored in 60 coastal areas. The monitored contents included the types and densities of litter in surface waters, on beaches, and on seabed.
Floating Litter The average quantity density of floating litter by visual surveys was 65 items/km2. The average quantity density of floating litter by trawling surveys was 2,859 items/km2, with an average weight density of 2.8 kg/km2.Plastics was the most common type and accounted for 86.2% of the total amount, followed by wood and paper, which accounted for 6.4% and 6.0% respectively. The plastic litter mainly consisted of foams, ropes, fragments, films and bottles.
Beach Litter The average quantity density of beach litter was 54,772 items/km², with an average weight density of 2,506 kg/km2. Plastics was the most common type and accounted for 84.5% of the total amount, followed by paper and glass, which accounted for 4.5% and 2.8% respectively. The plastic litter mainly consisted of cigarette filters, caps, foams, plastic packaging materials, fragments, bags, and ropes.
Seabed Litter The average quantity density of seabed litter was 2,947 items/km2, with an average weight density of 54.7 kg/km2. Plastics was the most common type and accounted for 86.8% of the total amount, followed by wood and metal, which accounted for 5.7% and 3.8% respectively. The plastic litter mainly consisted of ropes and packing bags.

Table 11: Main types of marine litter along coastal areas in China in 2022

Fig. 5 Quantitative distribution of marine litter along coastal areas in China in 2022
1.4 Radioactivity Level in Marine Environment
In 2022, marine radioactivity monitoring was carried out in 124 sites of sea areas under China's jurisdiction and 13 sea areas adjacent to nuclear power plants.
The natural radionuclide activity concentration of the sea areas was within the background level. No abnormality was observed in the artificial radionuclide activity concentration, and the activity concentrations of Sr-90 and Cs-137 in sea water were far below the limit set in the seawater quality standard. The natural radionuclide activity concentration of the coastal marine organisms was within the background level. No abnormality was observed in the artificial radionuclide activity concentration, and the activity concentrations of Sr-90 and Cs-137 in marine organisms were below the limit set in the Concentration Limits of Radioactive Materials in Food (GB14882-1994). The activity concentration of radionuclide related to facility activities in seawater, sediment and marine organisms in the sea areas adjacent to nuclear power plants was generally within the fluctuation range over the years. The evaluation results showed that the radiation dose to the public from the operation of all nuclear power plants was far below the national dose limits, and had no impact on environmental safety and public health.
Source: <https://english.mee.gov.cn/Resources/Reports/bomeaesoc/202311/P020231115438787813667.pdf>
Edited by Bao Lianying