
Statistical Communiqué of the People's Republic of China on the 2021 National Economic and Social Development[1]
Chapter 1 General Outlook
According to preliminary estimation, the gross domestic product (GDP)[2] in 2022 was 121,020.7 billion yuan, up by 3.0 percent over the previous year. Of this total, the value added of the primary industry was 8,834.5 billion yuan, up by 4.1 percent over the previous year, that of the secondary industry was 48,316.4 billion yuan, up by 3.8 percent and that of the tertiary industry was 63,869.8 billion yuan, up by 2.3 percent. The value added of the primary industry accounted for 7.3 percent of the GDP; that of the secondary industry accounted for 39.9 percent; and that of the tertiary industry accounted for 52.8 percent. The contribution of the final consumption expenditure to GDP growth rate was up by 1.0 percentage point, that of the gross capital formation to GDP growth rate up by 1.5 percentage points and that of the net exports of goods and services to GDP growth rate up by 0.5 percentage points. The per capita GDP in 2022 was 85,698 yuan, up by 3.0 percent over the previous year. The gross national income[3] in 2022 was 119,721.5 billion yuan, up by 2.8 percent over the previous year. The overall labor productivity[4] was 152,977 yuan per person, up by 4.2 percent over the previous year.
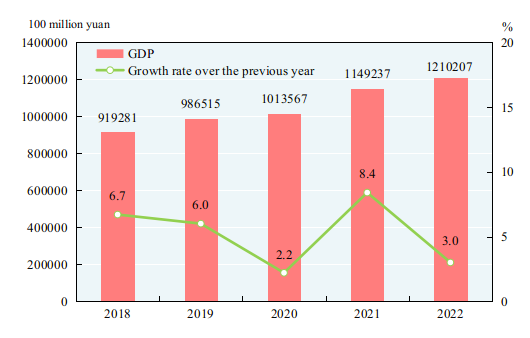
Figure 1: Gross Domestic Product and Growth Rates 2018-2022
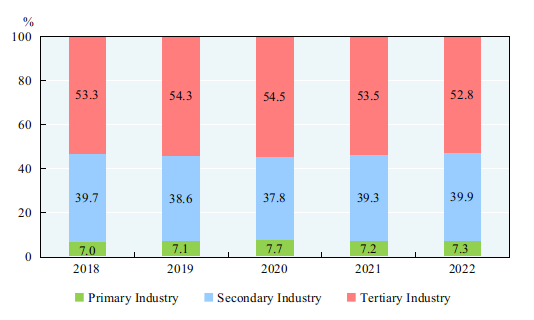
Figure 2: Shares of the Three Industries' Value Added in GDP 2018-2022
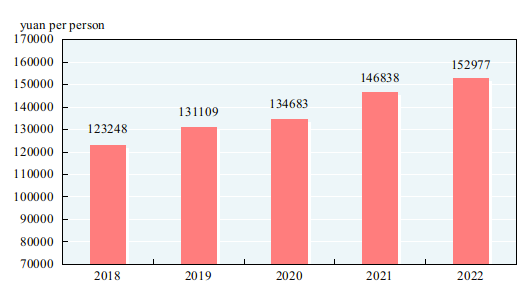
Figure 3: The Overall Labor Productivity 2018-2022[5]
By the end of 2022, the total number of national population[6] reached 1,411.75 million, a decrease of 0.85 million over that at the end of 2021. Of this total, urban permanent residents numbered 920.71 million. There were 9.56 million births in 2022 with a crude birth rate of 6.77 per thousand; and there were 10.41 million deaths with a crude death rate of 7.37 per thousand. The natural growth rate was -0.60 per thousand.
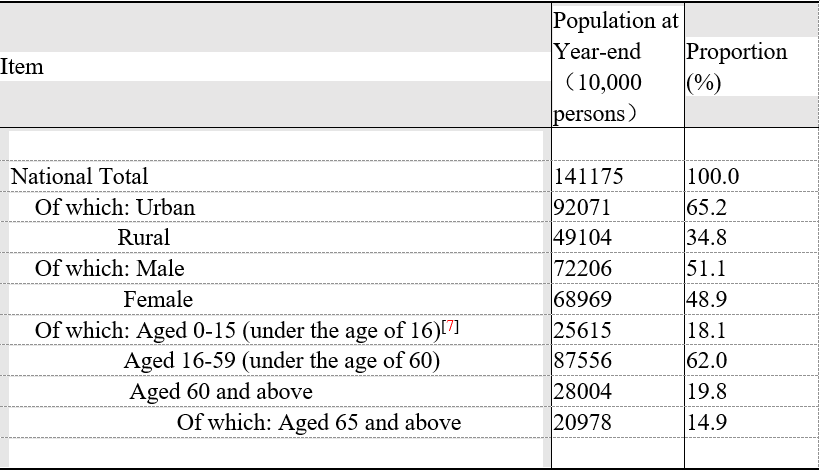
Table 1: Population and Its Composition by the End of 2022
At the end of 2022, the number of employed people in China was 733.51 million, and that in urban areas was 459.31 million, accounting for 62.6 percent of the total employed people. The newly increased employed people in urban areas numbered 12.06 million in 2022, 0.63 million less than that of the previous year. The surveyed urban unemployment rate in 2022 averaged 5.6 percent. The surveyed urban unemployment rate at the year end was 5.5 percent. The total number of migrant workers[8] was 295.62 million, up by 1.1 percent over that of 2021. Specifically, the number of migrant workers who left their hometowns and worked in other places was 171.90 million, up by 0.1 percent, and those who worked in their own localities reached 123.72 million, up by 2.4 percent.
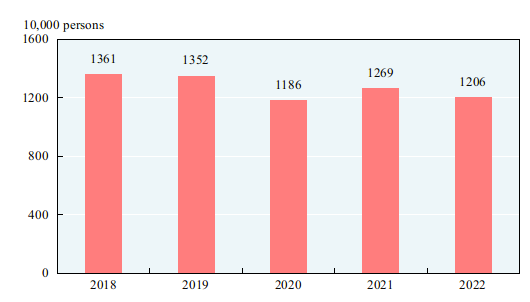
Figure 4:Newly Increased Employed People in Urban Areas 2018-2022
The consumer prices in 2022 went up by 2.0 percent over the previous year. The producer prices for industrial products went up by 4.1 percent and the purchasing prices for industrial producers up by 6.1 percent. The producer prices for farm products[9] grew up by 0.4 percent. In December, out of the 70 large and medium-sized cities, 16 cities experienced a year-on-year rise in sales prices of new commercial residential buildings, one city maintained the same and 53 cities experienced a decline; 6 cities experienced a year-on-year rise in sales prices of second-hand housing, and 64 cities experienced a decline.
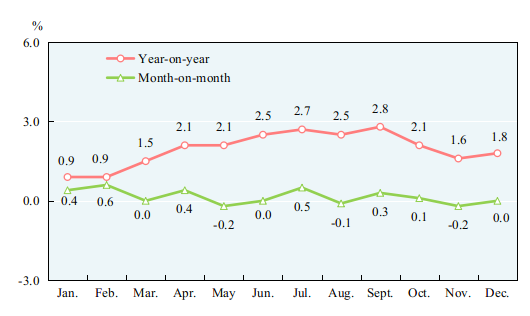
Figure 5:Monthly Changes of Consumer Prices in 2022
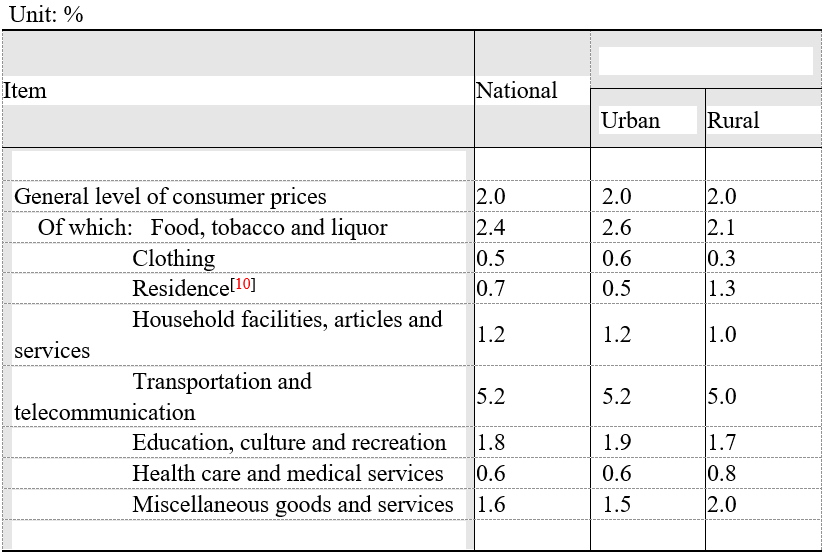
Table 2: Changes of Consumer Prices in 2022
At the end of 2022, China's foreign exchange reserves reached 3,127.7 billion US dollars, a decrease of 122.5 billion US dollars compared with that at the end of 2021. The average exchange rate of the year was 6.7261 RMB to 1 USD dollar, depreciated by 4.1 percent over that of 2021.
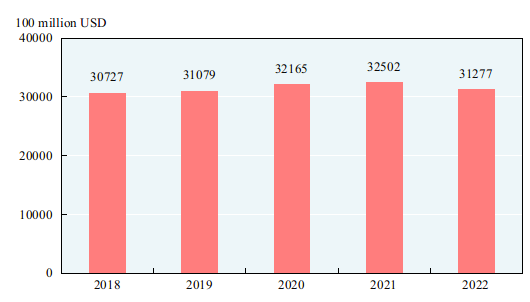
Figure 6:Year-end China's Foreign Exchange Reserves 2018-2022
New industries, new forms and models of business grew fast. Among the industries above the designated size, the value added of the high technology manufacturing industry[11] increased by 7.4 percent over the previous year, accounting for 15.5 percent of that of all industrial enterprises above the designated size. The value added for the manufacture of equipment[12] was up by 5.6 percent, accounting for 31.8 percent of that of all industrial enterprises above the designated size. Among the service enterprises above the designated size[13], the business revenue of the strategic emerging service industries[14] went up by 4.8 percent compared with the previous year. In 2022, the investment in high technology industries[15] increased by 18.9 percent over the previous year. In 2022, the output of new energy vehicles reached 7.003 million, up by 90.5 percent over the previous year; and that of solar cells (photovoltaic cells) was 0.34 billion kilowatts, up by 46.8 percent. In 2022, the e-commerce transactions[16] reached 43,829.9 billion yuan, up by 3.5 percent over the previous year on comparable basis. The online retail sales[17] in 2022 reached 13,785.3 billion yuan, up by 4.0 percent over the previous year on comparable basis. In 2022, the number of newly registered market entities was 29.08 million with 0.024 million market entities newly registered per day on average. By the end of 2022, the number of market entities reached nearly 0.17 billion in total.
Steady progress was made in the coordinated development across urban and rural areas and different regions. By the end of 2022, the urbanization rate of permanent residents reached 65.22 percent, 0.50 percentage points higher than that at the end of 2021. By region[18], in 2022, the gross domestic product in the eastern areas was 62,201.8 billion yuan, an increase of 2.5 percent over the previous year; the central areas, 26,651.3 billion yuan, up by 4.0 percent; the western areas, 25,698.5 billion yuan, up by 3.2 percent; and the northeastern areas, 5,794.6 billion yuan, up by 1.3 percent. In 2022, the gross domestic product in Beijing-Tianjin-Hebei Region reached 10,029.3 billion yuan, up by 2.0 percent over the previous year; that in the Yangtze River Economic Belt, 55,976.6 billion yuan, up by 3.0 percent; and that in the Yangtze River Delta, 29,028.9 billion yuan, up by 2.5 percent. Major regional strategies such as the construction of Guangdong-Hong Kong-Macao Greater Bay Areas, and the ecological protection and high-quality development of the Yellow River Basin were further implemented.
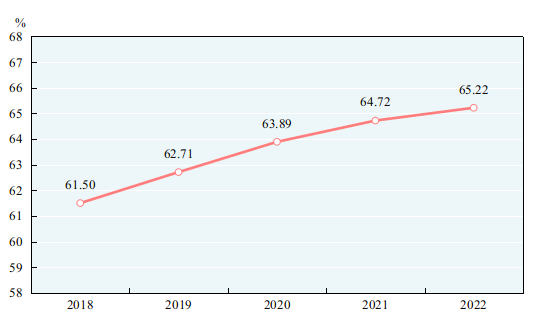
Figure 7:Year-end Urbanization Rates of Permanent Residents 2018-2022
New strides were made in green transformation. The national energy consumption per 10,000 yuan worth of GDP[19] in 2022 dropped by 0.1 percent over the previous year. In 2022, the electricity generated by clean energy such as hydropower, nuclear power, wind power and solar power was 2,959.9 billion kilowatts-hours, up by 8.5 percent over the previous year. Of the monitored 339 cities at prefecture level and above, 62.8 percent reached the air quality standard and 37.2 percent failed. The annual average concentration of particulate matter (PM2.5) was 29 micrograms per cubic meter, down by 3.3 percent over the previous year. Of the 3,641 sections under the national monitoring program for surface water, 87.9 percent were of fairly clean water quality (Grade I to III), 9.7 percent were Grade IV, 1.7 percent were Grade V and 0.7 percent were worse than Grade V national standard.
Notes:
[1] All figures in this Communiqué are preliminary statistics. Statistics in this Communiqué do not include Hong Kong SAR, Macao SAR and Taiwan Province. Due to the rounding-off reasons, the subentries may not add up to the aggregate totals.
[2] Gross domestic product (GDP), value added of the three and related industries, regional GDP, per capita GDP and gross national income (GNI) as quoted in this Communiqué are calculated at current prices whereas their growth rates are at constant prices.
[3] Gross national income, also known as gross national product, refers to the total primary distribution of the income created by all the resident units of a country (or a region) during a certain period of time. It equals to gross domestic product plus the net primary distribution of income from abroad.
[4] The overall labor productivity refers to the ratio between the GDP (at 2020 constant prices) and the total number of persons employed.
[5] See note 4.
[6] The national population refers to the population of the 31 provinces, autonomous regions and municipalities directly under the central government and servicemen of the Chinese mainland, excluding residents of Hong Kong, Macao and Taiwan and foreigners living in the 31 provinces, autonomous regions and municipalities directly under the central government.
[7] By the end of 2022, the population aged 0 to 14 (under the age of 15) was 239.08 million and that aged 15 to 59 (under the age of 60) was 892.63 million.
[8] The number of migrant workers includes those who are employed outside their villages and towns for more than six months in the year and those who are engaged in non-agricultural work in their villages and towns for more than six months in the year.
[9] The producer prices for farm products refer to the prices of farm products sold directly by producers.
[10] The prices for residence include prices for rent, maintenance and management, water, electricity and fuel, and services for owner-occupied housing etc.
[11] High technology manufacturing industry includes manufacture of medicine, manufacture of aerospace vehicle and equipment, manufacture of electronic and communication equipment, manufacture of computers and office equipment, manufacture of medical equipment, manufacture of measuring instrument and equipment and manufacture of optical and photographic equipment.
[12] Manufacture of equipment includes manufacture of metal products, general purpose equipment, special purpose equipment, automobiles, railway, ship, aerospace and other transport equipment, electrical machinery and apparatus, computers, communication and other electric equipment and measuring instrument and machinery.
[13] Service enterprises above the designated size refer to legal entities of transport, storage and post, information transmission, software and information technology services, water conservancy, environment and public facilities management, and health with annual business revenue of 20 million yuan and above; legal entities of real estate (excluding real estate development and operation), leasing and business services, scientific research and technology services and education with annual business revenue of 10 million yuan and above; and legal entities of services to households, repair and other services and culture, sports and entertainment, and social services with annual business revenue of 5 million and above.
[14] Strategic emerging service industries refer to the related service sectors of information technology of new generation, manufacture of high-end equipment, new materials, biotech, new energy vehicles, new energy, energy-saving and environmental protection and digital creative industries, and service industries related to new technology, innovation and entrepreneurship. The growth rate of the business revenue of the strategic emerging service industries in 2022 was calculated on a comparable basis.
[15] Investment in high technology industries refers to investment in six high technology manufacturing industries, including the manufacture of medicine and manufacture of aerospace vehicle and equipment, and nine high technology service industries, including information service and e-commerce service.
[16] E-commerce transactions refer to the transactions of goods and services realized through e-commerce trading platforms (including self-built and third-party platforms), including transactions with entities and individuals.
[17] Online retail sales refer to the retail sales of goods and services realized through internet trading platforms (online platforms mainly in trading physical commodities, including self-built websites and third-party platforms).
[18] The eastern areas include 10 provinces and municipalities: Beijing, Tianjin, Hebei, Shanghai, Jiangsu, Zhejiang, Fujian, Shandong, Guangdong and Hainan; the central areas cover 6 provinces: Shanxi, Anhui, Jiangxi, Henan, Hubei and Hunan; the western areas include 12 provinces, autonomous regions and municipalities: Inner Mongolia, Guangxi, Chongqing, Sichuan, Guizhou, Yunnan, Tibet, Shaanxi, Gansu, Qinghai, Ningxia and Xinjiang; the northeastern areas include 3 provinces: Liaoning, Jilin and Heilongjiang.
[19] The energy consumption per 10,000 yuan worth of GDP is calculated at 2020 constant prices.
Edited by Bao Lianying
with reference to <www.stats.gov.cn/english/PressRelease/202302/t20230227_1918979.html#>
Copyright @ 2014 Urban Planning Society of China
Registration Number:05073892-1
